2. Charm++ Debugger
2.1. Introduction
The primary goal of the Charm++ parallel debugger is to provide an integrated debugging environment that allows the programmer to examine the changing state of parallel programs during the course of their execution.
The Charm++ debugging system has a number of useful features for Charm++ programmers. The system includes a Java GUI client program which runs on the programmer’s desktop, and a Charm++ parallel program which acts as a server. The client and server need not be on the same machine, and communicate over the network using a secure protocol described in Converse Client-Server Interface.
The system provides the following features:
Provides a means to easily access and view the major programmer-visible entities, including array elements and messages in queues, across the parallel machine during program execution. Objects and messages are extracted as raw data, and interpreted by the debugger.
Provides an interface to set and remove breakpoints on remote entry points, which capture the major programmer-visible control flows in a Charm++ program.
Provides the ability to freeze and unfreeze the execution of selected processors of the parallel program, which allows a consistent snapshot by preventing things from changing as they are examined.
Provides a way to attach a sequential debugger to a specific subset of processes of the parallel program during execution, which keeps a manageable number of sequential debugger windows open. Currently these windows are opened independently of the GUI interface, while in the future they will be transformed into an integrated view.
The debugging client provides these features via extensive support built into the Charm++ runtime.
2.2. Building the Charm++ Debug Tool
To get the CharmDebug tool, check out the source code from the following repository. This will create a directory named ccs_tools. Change to this directory and build the project.
$ git clone https://charm.cs.illinois.edu/gerrit/ccs_tools
$ cd ccs_tools
$ ant
This will create the executable bin/charmdebug.
You can also download the binaries from the Charm++ downloads website and use it directly without building. (NOTE: Binaries may work properly on some platforms, so building from the source code is recommended.)
2.3. Preparing the Charm++ Application for Debugging
Build Charm++ using --enable-charmdebug option. For example:
$ ./build charm++ netlrts-darwin-x86_64 --enable-charmdebug
No instrumentation is required to use the Charm++ debugger. Being CCS based, you can use it to set and step through entry point breakpoints and examine Charm++ structures in any Charm++ application.
Nevertheless, for some features to be present, some additional options may be required at either compile or link time:
In order to provide a symbolic representation of the machine code executed by the application, the
-goption is needed at compile time. This setting is needed to provide function names as well as source file names and line numbers wherever useful. This is also important to fully utilize gdb (or any other serial debugger) on one or more processes.Optimization options, by nature of transforming the source code, can produce a mismatch between the function displayed in the debugger (for example in a stack trace) and the functions present in the source code. To produce information coherent with source code, optimization is discouraged. Newer versions of some compilers support the
-Ogoptimization level, which performs all optimizations that do not inhibit debugging.The link time option
-memory charmdebugis only needed if you want to use the Memory view (see 2.4.5.1) or the Inspector framework (see 2.4.5.2) in CharmDebug.
2.3.1. Record Replay
The Record Replay feature is independent of the charmdebug application. It is a mechanism used to detect bugs that happen rarely depending on the order in which messages are processed. The program in consideration is first executed in record mode which produces a trace. When the program is run in replay mode it uses previously recorded trace to ensure that messages are processed in the same order as the recorded run. The idea is to make use of a message sequence number to satisfy a theorem says that the serial numbers will be the same if the messages are processed in the same order. .. cite{rashmithesis}
Record Replay tracing is automatically enabled for Charm++ programs
and requires nothing special to be done during compilation. (Linking with
the option -tracemode recordreplay used to be necessary). At run
time, the +record option is used, which records messages in order in
a file for each processor. The same execution order can be replayed
using the +replay runtime option, which can be used at the same time
as the other debugging tools in Charm++.
Note! If your Charm++ is built with CMK_OPTIMIZE on, all tracing
will be disabled. So, use an unoptimized Charm++ to do your debugging.
2.4. Running the Debugger
2.4.1. CharmDebug command line parameters
-pesNumber of PEs
+pNumber of PEs
-hosthostname of CCS server for application
-userthe username to use to connect to the hostname selected
-portportnumber of CCS server for application
-sshtunnelforce the communication between client and server (in particular the one for CCS) to be tunnelled through ssh. This allow the bypass of firewalls.
-displayX Display
2.4.2. Basic usage
To run an application locally via the debugger on 4 PEs with command
line options for your program (shown here as opt1 opt2):
$ charmdebug pgm +p4 4 opt1 opt2
If the application should be run in a remote cluster behind a firewall, the previous command line will become:
$ charmdebug -host cluster.inst.edu -user myname -sshtunnel pgm +p4 4 opt1 opt2
CharmDebug can also be executed without any parameters. The user can
then choose the application to launch and its command line parameters
from within the File menu as shown in Figure 32.
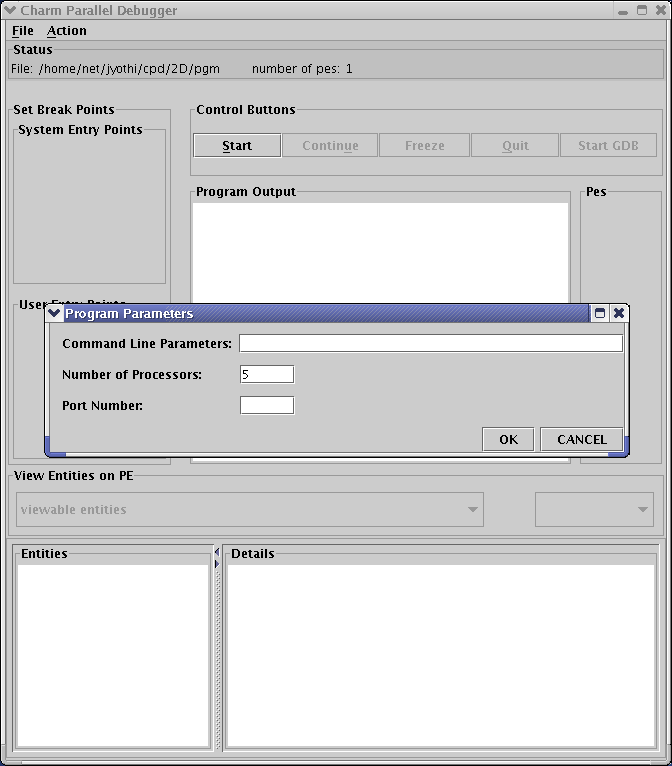
32 Using the menu to set parameters for the Charm++ program
Note: charmdebug command line launching only works on netlrts-* and verbs-* builds of Charm++.
To replay a previously recorded session:
$ charmdebug pgm +p4 opt1 opt2 +replay
2.4.4. CharmDebug limitations
2.4.4.1. Clusters
CharmDebug is currently limited to applications started directly by the debugger due to implementation peculiarities. It will be extended to support connection to remote running applications in the near future.
Due to the current implementation, the debugging tool is limited to netlrts-* and verbs-* versions. Other builds of Charm++ might have unexpected behavior. In the near future this will be extended at least to the mpi-* versions.
2.4.4.2. Record Replay
The Record Replay feature does not work well with spontaneous events. Load balancing is the most common form of spontaneous event in that it occurs periodically with no other causal event.
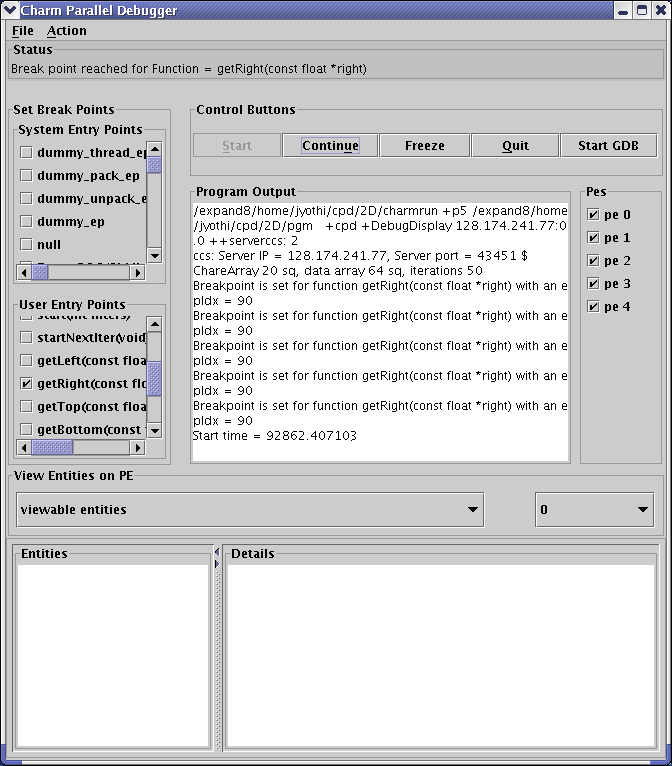
33 Parallel debugger when a break point is reached
As per Rashmi’s thesis:
“There are some unique issues for replay in the context of Charm because it provides high-level support for dynamic load balancing, quiescence detection and information sharing. Many of the load balancing strategies in Charm have a spontaneous component. The strategy periodically checks the sizes of the queues on the local processor. A replay load balancing strategy implements the known load redistribution. The behavior of the old balancing strategy is therefore not replayed only its effect is. Since minimal tracing is used by the replay mechanism the amount of perturbation due to tracing is reduced. The replay mechanism is proposed as a debugging support to replay asynchronous message arrival orders.”
Moreover, if your application crashes without a clean shutdown, the log may be lost with the application.
2.4.5. Using the Debugger
Once the debugger’s GUI loads, the programmer triggers the program execution by clicking the Start button. When starting by command line, the application is automatically started. The program begins by displaying the user and system entry points as a list of check boxes, pausing at the onset. The user could choose to set breakpoints by clicking on the corresponding entry points and kick off execution by clicking the Continue Button. Figure 33 shows a snapshot of the debugger when a breakpoint is reached. The program freezes when a breakpoint is reached.
Clicking the Freeze button during the execution of the program freezes execution, while Continue button resumes execution. The Quit button can be used to abort execution at any point of time. Entities (for instance, array elements) and their contents on any processor can be viewed at any point in time during execution as illustrated in Figure 34.
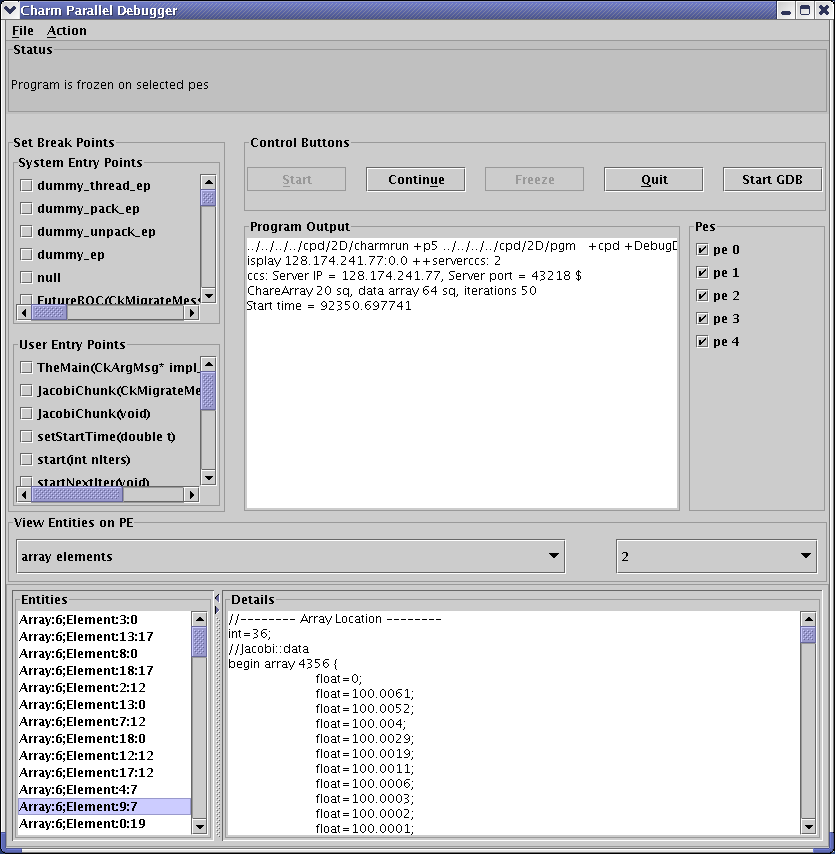
34 Freezing program execution and viewing the contents of an array element using the Parallel Debugger
Specific individual processes of the Charm++ program can be attached to instances of gdb as shown in Figure 35. The programmer chooses which PEs to connect gdb processes to via the checkboxes on the right side. Note! While the program is suspended in gdb for step debugging, high-level CharmDebug features such as object inspection will not work.
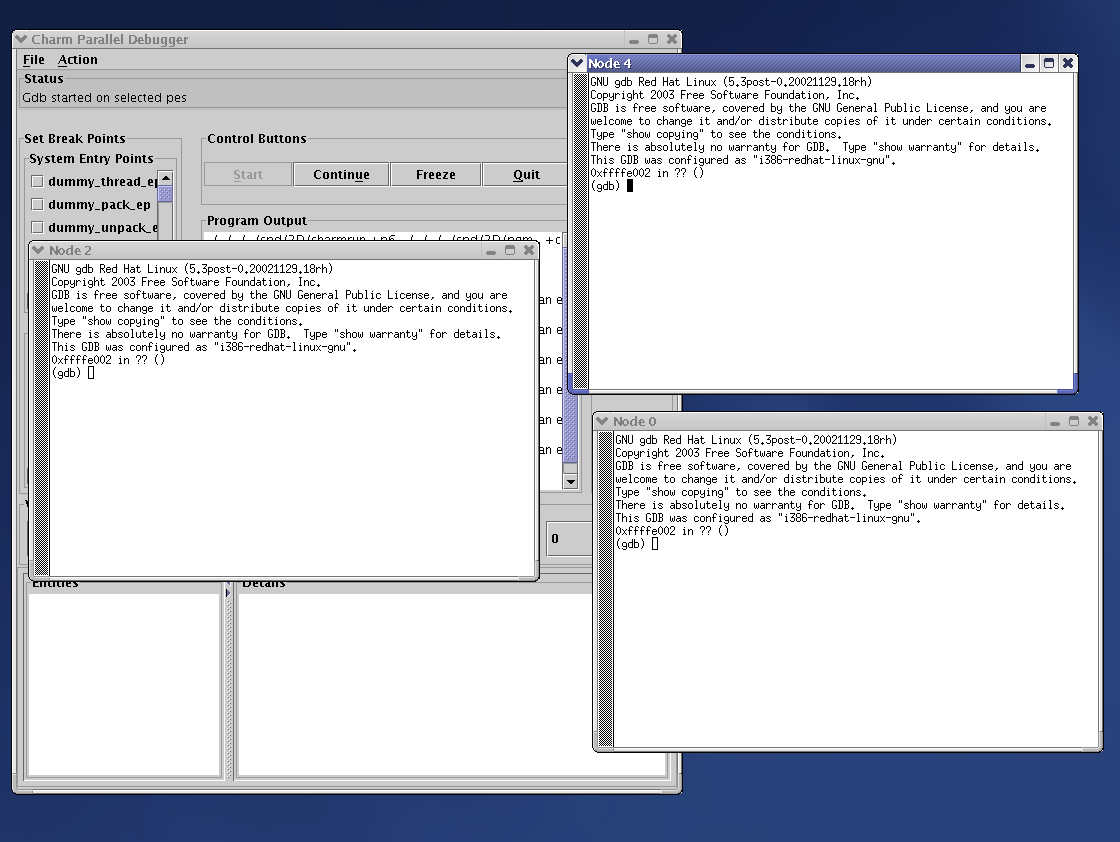
35 Parallel debugger showing instances of gdb open for the selected processor elements
Charm++ objects can be examined via the View Entities on PE : Display selector. It allows the user to choose from Charm Objects, Array Elements, Messages in Queue, Readonly Variables, Readonly Messages, Entry Points, Chare Types, Message Types and Mainchares. The right sideselector sets the PE upon which the request for display will be made. The user may then click on the Entity to see the details.
2.4.5.1. Memory View
The menu option Action \(\rightarrow\) Memory allows the user to display the entire memory layout of a specific processor. An example is shown in Figure 36. This layout is colored and the colors have the following meaning:
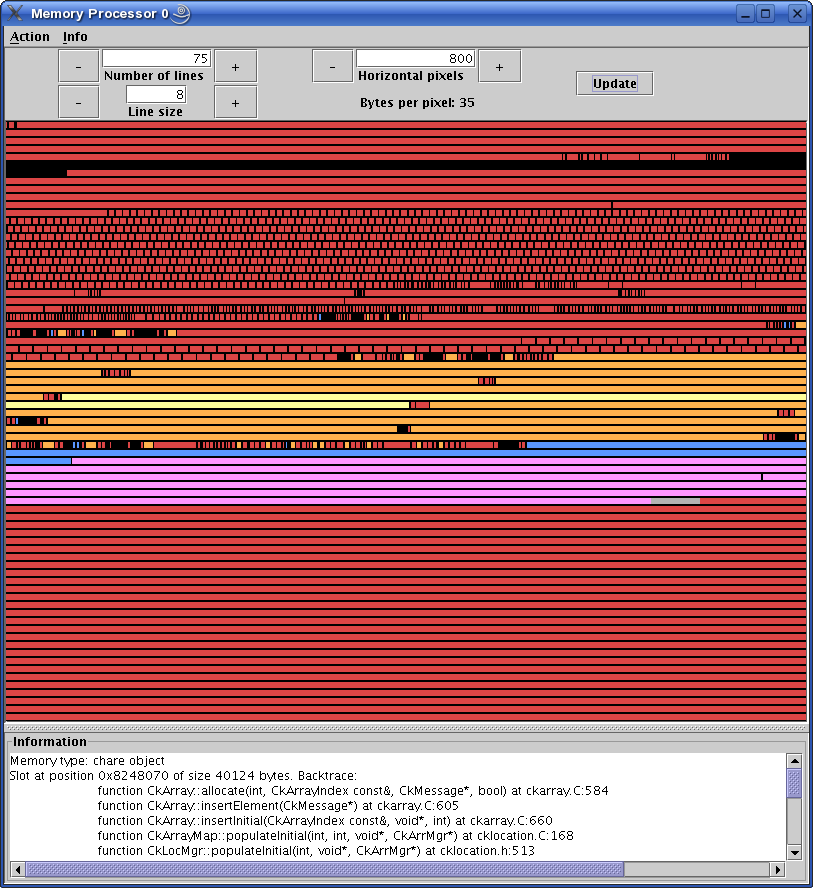
36 Main memory view
- red
memory allocated by the Charm++ Runtime System;
- blue
memory allocated directly by the user in its code;
- pink
memory used by messages;
- orange
memory allocated to a chare element;
- black
memory not allocated;
- gray
a big jump in memory addresses due to the memory pooling system, it represent a large portion of virtual space not used between two different zones of used virtual space address;
- yellow
the currently selected memory slot;
Currently it is not possible to change this color association. The bottom part of the view shows the stack trace at the moment when the highlighted (yellow) memory slot was allocated. By left clicking on a particular slot, this slot is fixed in highlight mode. This allows a more accurate inspection of its stack trace when this is large and does not fit the window.
Info \(\rightarrow\)Show Statistics will display a small information box like the one in Figure 37.
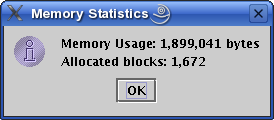
37 Information box display memory statistics
A useful tool of this view is the memory leak search. This is located in the menu Action \(\rightarrow\) Search Leaks. The processor under inspection runs a reachability test on every memory slot allocated to find if there is a pointer to it. If there is none, the slot is partially colored in green, to indicate its status of leak. The user can the inspect further these slots. Figure 38 shows some leaks being detected.
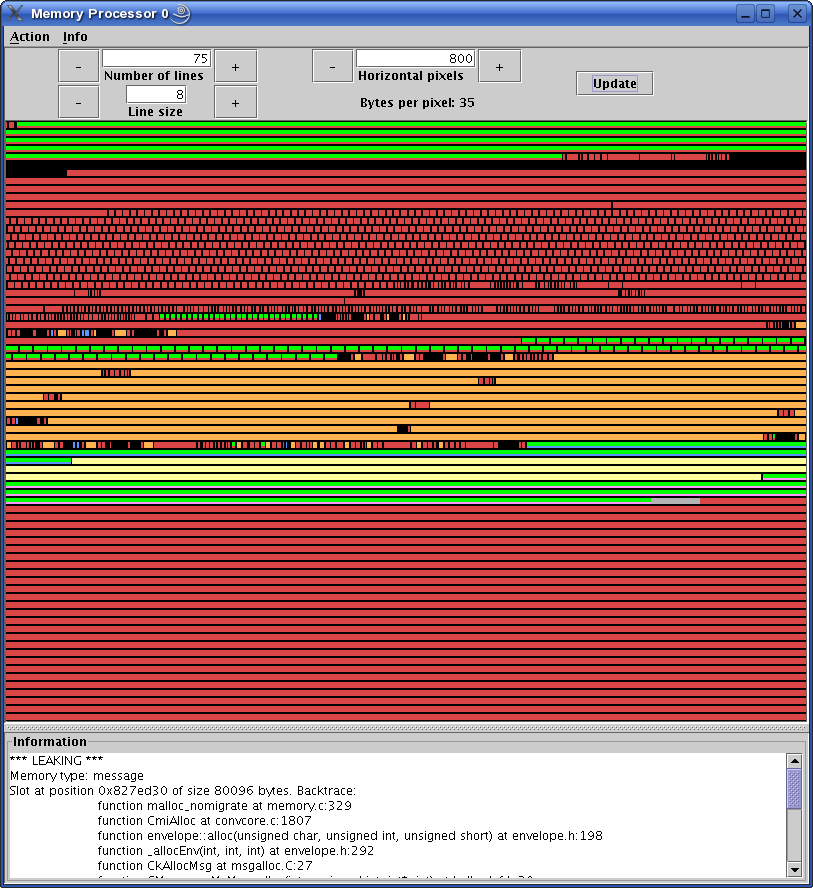
38 Memory view after running the Search Leaks tool
If the memory window is kept open while the application is unfrozen and makes progress, the loaded image will become obsolete. To cope with this, the “Update” button will refresh the view to the current allocation status. All the leaks that had been already found as such, will still be partially colored in green, while the newly allocated slots will not, even if leaking. To update the leak status, re-run the Search Leaks tool.
Finally, when a specific slot is highlighted, the menu Action \(\rightarrow\) Inspect opens a new window displaying the content of the memory in that slot, as interpreted by the debugger (see next subsection for more details on this).
2.4.5.2. Inspector framework
Without any code rewriting of the application, CharmDebug is capable of loading a raw area of memory and parsing it with a given type name. The result (as shown in Figure 39, is a browsable tree. The initial type of a memory area is given by its virtual table pointer (Charm++ objects are virtual and therefore loadable). In the case of memory slots not containing classes with virtual methods, no display will be possible.
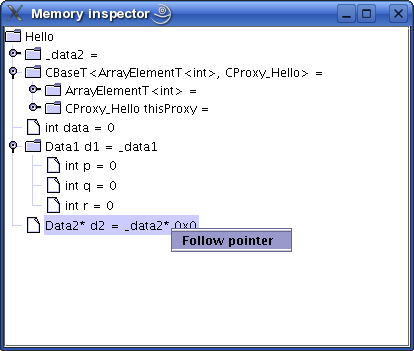
39 Raw memory parsed and displayed as a tree
When the view is open and is displaying a type, by right clicking on a leaf containing a pointer to another memory location, a popup menu will allow the user to ask for its dereference (shown in Figure 39). In this case, CharmDebug will load this raw data as well and parse it with the given type name of the pointer. This dereference will be inlined and the leaf will become an internal node of the browse tree.
2.5. Debugger Implementation Details
The following classes in the PUP framework were used in implementing debugging support in charm.
class PUP::er- This class is the abstract superclass of all the other classes in the framework. Thepupmethod of a particular class takes a reference to aPUP::eras parameter. This class has methods for dealing with all the basic C++ data types. All these methods are expressed in terms of a generic pure virtual method. Subclasses only need to provide the generic method.class PUP::toText- This is a subclass of thePUP::toTextUtilclass which is a subclass of thePUP::erclass. It copies the data of an object to a C string, including the terminating NULL.class PUP::sizerText- This is a subclass of thePUP::toTextUtilclass which is a subclass of thePUP::erclass. It returns the number of characters including the terminating NULL and is used by thePUP::toTextobject to allocate space for building the C string.
The code below shows a simple class declaration that includes a pup
method.
class foo {
 private:
  bool isBar;
  int x;
  char y;
  unsigned long z;
  float q[3];
 public:
  void pup(PUP::er &p) {
    p(isBar);
    p(x);p(y);p(z);
    p(q,3);
  }
};
2.5.1. Converse Client-Server Interface
The Converse Client-Server (CCS) module enables Converse
.. cite{InterOpIPPS96}
programs to act as parallel servers,
responding to requests from non-Converse programs. The CCS module is
split into two parts – client and server. The server side is used by
Converse programs while the client side is used by arbitrary non-Converse
programs. A CCS client accesses a running Converse program by talking to
a server-host which receives the CCS requests and relays them to the
appropriate processor. The server-host is charmrun
.. cite{charmman}
for netlrts- versions and is the first
processor for all other versions.
In the case of the netlrts- version of Charm++, a Converse program is
started as a server by running the Charm++ program using the additional
runtime option ++server. This opens the CCS server on any TCP port
number. The TCP port number can be specified using the command-line
option server-port. A CCS client connects to a CCS server, asks a
server PE to execute a pre-registered handler and receives the response
data. The function CcsConnect takes a pointer to a CcsServer as
an argument and connects to the given CCS server. The functions
CcsNumNodes, CcsNumPes, and CcsNodeSize implemented as part of
the client interface in Charm++ return information about the parallel
machine. The function CcsSendRequest takes a handler ID and the
destination processor number as arguments and asks the server to execute
the requested handler on the specified processor. CcsRecvResponse
receives a response to the previous request in-place. A timeout is also
specified which gives the number of seconds to wait until the function
returns 0, otherwise the number of bytes received is returned.
Once a request arrives on a CCS server socket, the CCS server runtime
looks up the appropriate registered handler and calls it. If no handler
is found the runtime prints a diagnostic and ignores the message. If the
CCS module is disabled in the core, all CCS routines become macros
returning 0. The function CcsRegisterHandler is used to register
handlers in the CCS server. A handler ID string and a function pointer
are passed as parameters. A table of strings corresponding to
appropriate function pointers is created. Various built-in functions are
provided which can be called from within a CCS handler. The debugger
behaves as a CCS client invoking appropriate handlers which make use of
some of these functions. Some of the built-in functions are as follows.
CcsSendReply- This function sends the data provided as an argument back to the client as a reply. This function can only be called from a CCS handler invoked remotely.CcsDelayReply- This call is made to allow a CCS reply to be delayed until after the handler has completed.
The CCS runtime system provides several built-in CCS handlers, which are
available to any Converse program. All Charm++ programs are essentially
Converse programs. ccs_getinfo takes an empty message and responds
with information about the parallel job. Similarly the handler
ccs_killport allows a client to be notified when a parallel run
exits.